

jQuery Flot – a more complex example
The goal of this jflot interface was in essence a combination of the military budgets example and the zooming with overview example.
It turned out to be more complicated than just pasting the code from both. In any case, the take away here is that this is a very capable library and I’m surely going to use it more in the future.
Anyway below is a screenshot of the result so far.
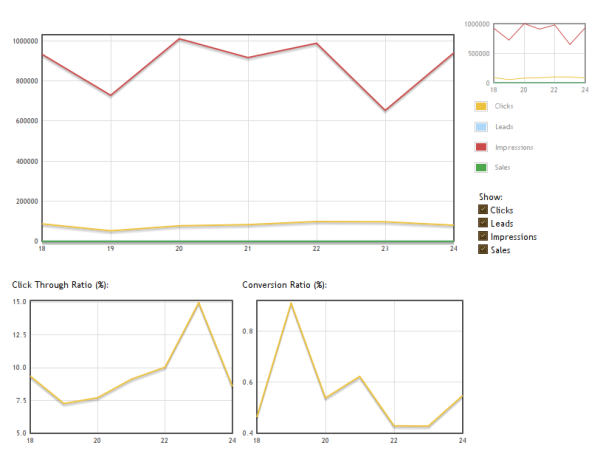
All the graphs are zoomable and the bottom two are separate, there is no connection to the big one whatsoever. When any of the checkboxes are toggled the zooming is reset in the big one. The day of the month is on the x-axis and whatever corresponding value/percentage on the y-axis.
Let’s go through the code:
<!--[if IE]><script language="javascript" type="text/javascript" src="{$baseUrl}/js/excanvas.pack.js"></script><![endif]-->
<SCRIPT type="text/javascript" src="{$baseUrl}/js/jquery.flot.pack.js"></SCRIPT>
<script type="text/javascript" src="{$baseUrl}/js/jquery.datePicker.js"></script>
<script type="text/javascript" src="{$baseUrl}/js/date.js"></script>
<script type="text/javascript" src="{$baseUrl}/js/date_{$language}.js"></script>
<!--[if IE]><script type="text/javascript" src="{$baseUrl}/js/jquery.bgiframe.js"></script><![endif]-->
<link rel="stylesheet" href="{$designDir}/css/datePicker.css" type="text/css" />
The date scripts are jFlot dependencies, not the datePicker though, that one is used in another part of the interface that this tutorial doesn’t cover.
var imprLbl		= "{#impressions#}";
var clickLbl	= "{#clicks#}";
var saleLbl		= "{#sales#}";
var leadLbl		= "{#leads#}";
var startData 	= {$data};
{literal}

var labels = [clickLbl, leadLbl, imprLbl, saleLbl];

var startData 	= fixDatesLabels(startData, labels);
var curData		= startData;

var styling = {
    legend: { show: false },
    selection: { mode: "xy" }
};

function fixDatesLabels(data, labels){
	var robj = {};
	for(var i in data){
		var tmp = [];
	    $.each(data[i], function(){
			var date = new Date(this[0] * 1000);
			tmp.push([date.getDate(), this[1]]);
		});
		var curKey = labels[i];
		robj[curKey] = {'label': curKey, 'data': tmp};
	}
	return robj;
}
This above code is within script tags at the top of the HTML. It is rendered with Smarty, hence the {literal} to escape the Javascript. Above the literal though we assign some labels that can be multilingual since they are fetched from a config file.
The styling is saved to a variable because it will be used in several places later on. Note that we do not show the legend in the canvas itself (show: false). Selection mode is both axises to allow for an arbitrary zooming.
The startData and curData variables are needed to keep track of the original data and the currently zoomed data, more on that later. The fixDatesLabels function is needed to convert PHP timestamps (that is why we multiply by 1000 to get from PHP’s seconds to Javascript’s milliseconds). Originally I did the timestamp to day of the month conversion in PHP but I decided to move it into the Javascript to offload the server, it isn’t too much of a hassle anyway when using the extra date stuff that we included above.
The central part is where we push each x/y pair by calling date.getDate() for the x-value (the day of month) and the y-value (amount of whatever) which is not treated at all, just copied (this[1]). The result is in any case an array that can be used by jFlot to draw the graph.
function getMax(data){
	var maxy = 0;
	$.each(data, function(key, val) {
	    $.each(val['data'], function(){
			maxy = this[1] > maxy ? this[1] : maxy;
		});
	});
	return maxy;
}
This function will simply get the maximum value from any given jFlot dataset by looping over them with jQuery each. This function will be used later in the zooming to keep track of the upper limit of the zoom.
function valuesByLbl(data, lbl){
	for(var i in data){
		if(data[i]['label'] == lbl)
			return data[i]['data'];
	}
	return false;
}

function getRatio(data, key1, key2){
	var rarr 	= new Array();
	var arr1 	= valuesByLbl(data, key1);
	var arr2 	= valuesByLbl(data, key2);
	if(arr1 && arr2){
		for(var i in arr1)
			rarr.push([arr1[i][0], (arr1[i][1] / arr2[i][1]) * 100]);
	}
	return [rarr];
}
This function is used to create the two smaller ratio graphs at the bottom from the start data used in the big canvas. In this case the x-values stay the same and the y-values are calculated from the two passed keys which in turn are used in the valuesByLbl function to retrieve the correct data to work with.
function getOverviewStyle(data){
	return {
	    legend: { show: true, container: $("#overviewLegend") },
	    lines: { show: true, lineWidth: 1 },
	    shadowSize: 0,
	    xaxis: { ticks: 4 },
	    yaxis: { ticks: 3, min: 0, max: getMax(data)},
	    grid: { color: "#999" },
	    selection: { mode: "xy" }
	}
}
Simple convenience function used to get the styling for the small overview window. Note that we need to pass the data we are currently working with in order to get the max value to use in the y-axis.
var crtplot = $.plot($("#ctrplot"), getRatio(startData, clickLbl, imprLbl), styling);
setupZoom(crtplot, "#ctrplot", clickLbl, imprLbl);

var crplot = $.plot($("#crplot"), getRatio(startData, saleLbl, clickLbl), styling);
setupZoom(crplot, "#crplot", saleLbl, clickLbl);

function setupZoom(plotObj, idStr, label1, label2){
	$(idStr).bind("selected", function (event, area) {
	    plotObj = $.plot(
			$(idStr),
			getRatio(startData, label1, label2),
			$.extend(true, {}, styling, {
				xaxis: { min: area.x1, max: area.x2 },
				yaxis: { min: area.y1, max: area.y2 }
		}));
	});
}
We setup the smaller ratio windows (CTR and CR). We use the getRatio function to retrieve the data to work with. When the objects are created their zooming is setup with setupZoom. If used with curData instead of startData all the time this function could be used to zoom these smaller ones programmatically as a response to zomming in the big canvas. However, at the moment this is not a wanted behavior.
var plot 				= $.plot($("#mainplot"), startData, styling);
var overview 			= $.plot($("#overview"), startData, getOverviewStyle(startData));
var internalSelection 	= false;
We create the big plot and its overview window.
$("#mainplot").bind("selected", function (event, area) {
    if (area.x2 - area.x1 < 0.00001)
        area.x2 = area.x1 + 0.00001;
    if (area.y2 - area.y1 < 0.00001)
        area.y2 = area.y1 + 0.00001;

    plot = $.plot(
		$("#mainplot"),
		curData,
		$.extend(true, {}, styling, {
			xaxis: { min: area.x1, max: area.x2 },
			yaxis: { min: area.y1, max: area.y2 }
		}));

    if (internalSelection)
        return;

    internalSelection = true;
    overview.setSelection(area);
    internalSelection = false;
});

$("#overview").bind("selected", function (event, area) {
    if (internalSelection)
        return;
    internalSelection = true;
    plot.setSelection(area);
    internalSelection = false;
});
The big graph and its overview window is being connected to each other, to be honest I don’t have much of a clue as to what exactly this code is doing, see the source of the examples I link to in the beginning of this tutorial for more info. Most of the above code is simply copy pasted from one of them. It’s safe to assume however that they setup the interactive connection between the windows and is therefore responsible for changing the zooming in the big window when a rectangle is drawn in the small window.
In any case the most important thing here is the use of curData to maintain this functionality in a proper way even when we toggle the checkboxes on and off.
var i = 0;
var choiceContainer = $("#choices");
$.each(startData, function(key, val) {
    val.color = i;
	choiceContainer.append('<br/><input type="checkbox" name="' + key +
                           '" checked="checked" > ' + val.label + '</input>');
    ++i;
});

choiceContainer.find("input").click(plotAccordingToChoices);
The choice checkboxes are added. We use the startData which has already got its labels set by the fixDatesLabels function explained above. Finally we connect any click on any of the checkboxes to plotAccordingToChoices():
function plotAccordingToChoices() {
    $("#overviewLegend").html('');

    var data = [];

    choiceContainer.find("input:checked").each(function () {
        var key = $(this).attr("name");
        if (key && startData[key])
            data.push(startData[key]);
    });

    if (data.length > 0){
    	$.plot($("#mainplot"), data, styling);
		$.plot($("#overview"), data, getOverviewStyle(data));
	}
	curData = data;
}

plotAccordingToChoices();
The contents of the legend are erased on each call, otherwise its contents would be duplicated and appended on each call to this function (by the on click connection to each checkbox). We start with an empty array as the current data. We then loop through each checkbox, all checked ones get their data pushed on top of the new data array by using their names as key (yes names containing non ascii characters – for instance German – will work just fine).
We then re-plot with the help of our new data array and store it in the curData variable which will now contain information that differs from the content in the startData variable. As you remember the curData is used in the binding logic that connects the overview to the big canvas/window.
Note the final call to the function that will make it draw all graphs since all checkboxes will start out as checked.
And the Smarty skeleton template:
{/literal}
</script>
<table>
	<tr>
		<td rowspan="2">
			<div id="mainplot" style="width:600px;height:300px;"></div>
		</td>
		<td>
			<div id="overview" style="width:166px;height:100px"></div>
			<p id="overviewLegend" style="margin-left:10px"></p>
			<p id="choices" style="margin-left:20px">{#show#}:</p>
		</td>
	</tr>
</table>
<table>
	<tr>
		<td>
			{#ctrlbl#}:
		</td>
		<td>
			{#conversionlbl#}:
		</td>
	</tr>
	<tr>
		<td>
			<div id="ctrplot" style="width:300px; height:200px;"></div>
		</td>
		<td>
			<div id="crplot" style="width:300px; height:200px;"></div>
		</td>
	</tr>
</table>
As per the instructions on the Flot homepage the divs are styled with width and height.